


Spend to Win, or Not.
How Much MLB Teams Spend for a Win
ST LOUIS — With time running out in Major League Baseball’s playoff race, you may be uncertain of how things will end up.
The Orioles, A’s, and Angels are cruising along and are in line to receive three of the five American League playoff berths, leaving the Mariners, Yankees, and Tigers to battle it out for the remaining two.
The National League’s Dodgers and Nationals are in sole control of their divisions. Although their chances of missing the playoffs are quite slim, with five weeks left, anything could happen.
As for the last three NL berths, four teams, the Cardinals, Giants, Braves and Pirates, are prime contenders.
From 2012, four teams, Baltimore, Oakland, Washington and L.A.D., lead their divisions and are in a position to return to the playoffs once again. Only two teams, the A’s and the Dodgers, seem certain of making the playoffs for the second time in a row. The A’s could make their third appearance in three years.
Isn’t that the beauty of baseball? Everyone plays and has a chance to win. A while back, this simple feeling of hope was completely impossible. Before, playoff berths were based on the amount of money a team spent, and that is certainly not the case anymore.
Top spenders, New York, Philadelphia and Boston, are in trouble and need to pick up games fast for any shot at postseason baseball.
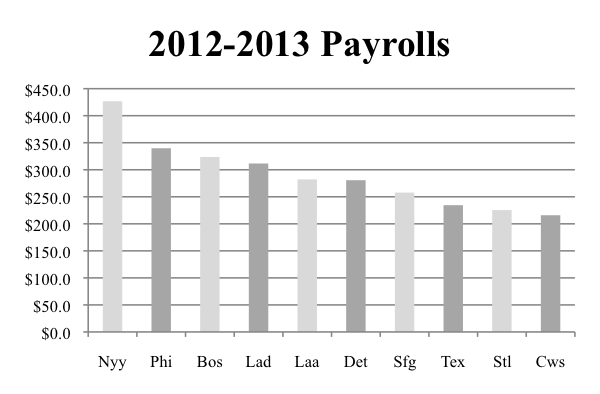
Through the last two seasons, familiar franchise spenders have occupied the top and bottom of the salary pile; the Yankees head off the list with an approximate $426.7 million spent on payroll.
But opulence is not always a means for success.
In the last two years, six organizations, Atlanta, Oakland, Cincinnati, Washington, Tampa Bay, and Baltimore recorded top ten win percentages with payrolls towards the lower end of the heap. Washington ranked 11th and Cincinnati 14th on the list, with the remaining four teams settling in the bottom half clubs for lowest payroll. Only four of the top ten spenders, St. Louis, Texas, Detroit and New York, recorded top ten win percentages, lending to an overall poor use of dollars to manufacture the end goal of wins.
Given this, who’s win actually cost them the least amount of money?
To understand this, each team’s salary was divided by their total wins ranging from the last two years. Such a statistic is useful in finding which teams spent and won, and which teams spent and lost. In the end, the formula shows that it is possible for teams to spend less for regular season wins.
But does this ultimately translate to the postseason?
Although Houston quietly sits at third on the graph for lowest cost per regular season win, in the last two years, the ‘Stros have finished a total of 87 games back behind their division leader, averaging a win percentage of .327. Conversely, Philadelphia spent $2.21 million for an overall win percentage of .475 and no playoff appearances, while the L.A. Angels spent $1.69 million to finish third in the division twice, with a win percentage of .515 and no playoff appearances.
Just five of the top ten spenders per win, New York, Boston, L.A. Dodgers, Detroit and San Francisco, secured playoff berths. The remaining ten postseason-bound teams settled between average (Texas, St Louis, Washington and Cincinnati) and most economical spenders (Cleveland, Baltimore, Pittsburgh, Atlanta Tampa Bay and Oakland).
Oakland stands unrivaled as the most cost-efficient team in the big leagues regarding regular season wins; giving up just over half a million for each W. Thank you Billy Bean.
With the proof that large salaries do not always follow suit in relation to more wins, the underlying question remains: How does this further translate into October?
The MLB playoffs aren’t a couple of home games for playoff teams to garner millions. They’re an opportunity for the fortunate to get a return on their investment. Which restates the obviously economical view of success at the Major League level.
Of the fifteen teams that composed the 2012 and 2013 postseason brackets, none compare to the sheer dominance of the St. Louis Cardinals. With a total of 150 games played in the combined playoff seasons, the Redbirds accounted for twenty percent of all playoff games played, compiling a record of 16-14; tops in the Majors.
In regards to cost per playoff wins, St. Louis once again takes prime position as most efficient. Spending just $14.1 million for each postseason victory, the Cardinals are separated by $9.3 million from the next competitor, the Tigers. Interestingly enough, Oakland placed fourth on the graph spending twice as much as the Cardinals spend for one win.
Contrary to regular season play, four of the top five economically savvy postseason teams were ranked in the top ten for highest payroll. Four of the five highest spenders per postseason win were teams that had previously scored under the $90 million line as relative misers at the bottom of the payroll.
In conclusion, no matter how much a team spends, success in the MLB remains dependent on the factor of how wisely a franchise spends their salary and how adept the team’s manager is.
The Cardinals have fared well in both these areas.